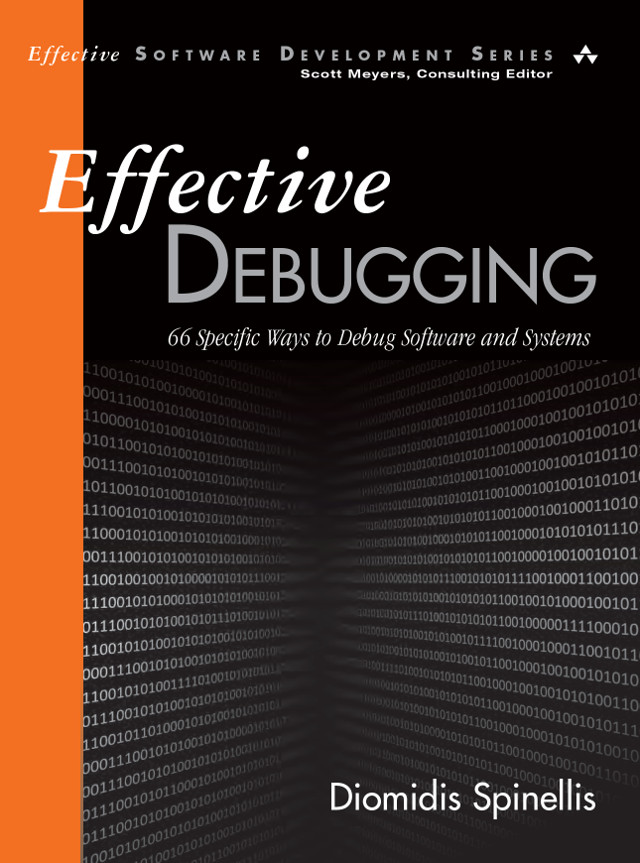
Effective Debugging
66 Specific Ways to Debug
Software and Systems
All effective approaches for debugging your applications and systems summarized in a single book!
Full table of contents
Click on a chapter title to expand it.
- Handle All Problems through an Issue-Tracking System
- Use Focused Queries to Search the Web for Insights into Your Problem
- Confirm That Preconditions and Postconditions Are Satisfied
- Drill Up from the Problem to the Bug or Down from the Program's Start to the Bug
- Find the Difference between a Known Good System and a Failing One
- Use the Software's Debugging Facilities
- Diversify Your Build and Execution Environment
- Focus Your Work on the Most Important Problems
- Set Yourself Up for Debugging Success
- Enable the Efficient Reproduction of the Problem
- Minimize the Turnaround Time from Your Changes to Their Result
- Automate Complex Testing Scenarios
- Enable a Comprehensive Overview of Your Debugging Data
- Consider Updating Your Software
- Consult Third-Party Source Code for Insights on Its Use
- Use Specialized Monitoring and Test Equipment
- Increase the Prominence of a Failure's Effects
- Enable the Debugging of Unwieldy Systems from Your Desk
- Automate Debugging Tasks
- Houseclean Before and After Debugging
- Fix All Instances of a Problem Class
- Analyze Debug Data with Unix Command-Line Tools
- Utilize Command-Line Tool Options and Idioms
- Explore Debug Data with Your Editor
- Optimize Your Work Environment
- Hunt the Causes and History of Bugs with the Revision Control System
- Use Monitoring Tools on Systems Composed of Independent Processes
- Use Code Compiled for Symbolic Debugging
- Step through the Code
- Use Code and Data Breakpoints
- Familiarize Yourself with Reverse Debugging
- Navigate along the Calls between Routines
- Look for Errors by Examining the Values of Variables and Expressions
- Know How to Attach a Debugger to a Running Process
- Know How to Work with Core Dumps
- Tune Your Debugging Tools
- Know How to View Assembly Code and Raw Memory
- Review and Manually Execute Suspect Code
- Go Over Your Code and Reasoning with a Colleague
- Add Debugging Functionality
- Add Logging Statements
- Use Unit Tests
- Use Assertions
- Verify Your Reasoning by Perturbing the Debugged Program
- Minimize the Differences between a Working Example and the Failing Code
- Simplify the Suspect Code
- Consider Rewriting the Suspect Code in Another Language
- Improve the Suspect Code's Readability and Structure
- Fix the Bug's Cause, Rather Than Its Symptom
- Examine Generated Code
- Use Static Program Analysis
- Configure Deterministic Builds and Executions
- Configure the Use of Debugging Libraries and Checks
- Find the Fault by Constructing a Test Case
- Fail Fast
- Examine Application Log Files
- Profile the Operation of Systems and Processes
- Trace the Code's Execution
- Use Dynamic Program Analysis Tools
- Analyze Deadlocks with Postmortem Debugging
- Capture and Replicate
- Uncover Deadlocks and Race Conditions with Specialized Tools
- Isolate and Remove Nondeterminism
- Investigate Scalability Issues by Looking at Contention
- Locate False Sharing by Using Performance Counters
- Consider Rewriting the Code Using Higher-Level Abstractions


