Language is a very powerful way to describe behavior. Therefore even when I create pictures, instead of dragging around my mouse, I use declarative tools like GraphViz, gnuplot, and UMLGraph. These allow me to describe what I want to draw, instead of how I want the end-result to look like. The truth however is that the end-results are not always perfect. Today I realized that the state of the art has advanced to the point where I can create the drawing declaratively, and then visually polish the final drawing.
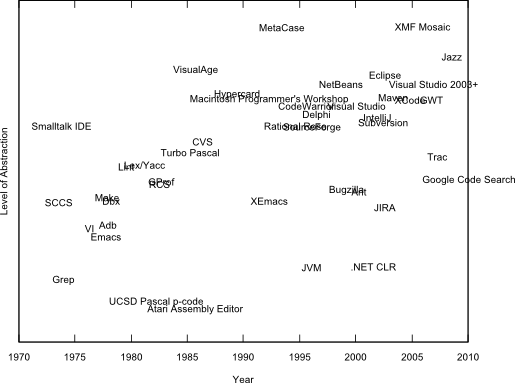
Here is an example. For an IEEE Software special-issue on development tools that I'm co-authoring we wrote a table listing the introduction date and level of abstraction of various tools. Here is an excerpt (I'm using an early draft version of the data).
# Abstraction:Year:Tool
4:1977:Make
5:1979:Lex/Yacc
6:1971:Smalltalk IDE
4:1972:SCCS
2:1973:Grep
I then wrote a small awk script to convert this into gnuplot.
#!/usr/bin/awk -F:
BEGIN {
	print "reset"
	print "set terminal svg"
	print "set output 'timeline.svg";
	print "unset ytics";
	print "set ylabel 'Level of Abstraction'"
	print "set xlabel 'Year'"
}
!/^#/ {
	# Random pertrubation by +/- 0.5
	$2 += rand() - 0.5
	$1 += rand() - 0.5
	print "set label \"" $3 "\" at " $2 ", " $1
}
END {
	print "plot [1970:2010] [0:9] -1 notitle"
	print "set output 'nul'"
}

As you can see, despite the random pertrubation I introduced, many of the labels overlap. (Surprisingly, Excel 2000 can't create such a chart without either entering each label by hand, or adding a third-party add-in.)
However, I then loaded the resulting SVG file into
Inkscape.
It loaded perfectly, and I was thus able to
easily adjust the labels' positions using the mouse.
Here is the result after the fine-tuning.

Unix make vs Apache Airflow (2024-10-15)
How (and how not) to present related work (2024-08-05)
An exception handling revelation (2024-02-05)
Extending the life of TomTom wearables (2023-09-01)
How AGI can conquer the world and what to do about it (2023-04-13)
Twitter's overrated dissemination capacity (2023-04-02)
The hypocritical call to pause giant AI (2023-03-30)
AI deforests the knowledge’s ecosystem (2023-03-16)
How I fixed git-grep macOS UTF-8 support (2022-10-12)
Last modified: Saturday, May 24, 2008 9:48 pm
Unless otherwise expressly stated, all original material on this page created by Diomidis Spinellis is licensed under a Creative Commons Attribution-NonCommercial 4.0 International License.


