Over the past three years I've been collecting the amazon.com Sales Rank for my book Code Reading: The Open Source Perspective, and (lately) also for its sequel Code Quality: The Open Source Perspective. Yesterday I mapped the sales rank to actual sales, and correlated those with significant events and hits on the book's web page.
The book's hourly sales rank over the last three years isn't particularly
enlightening.
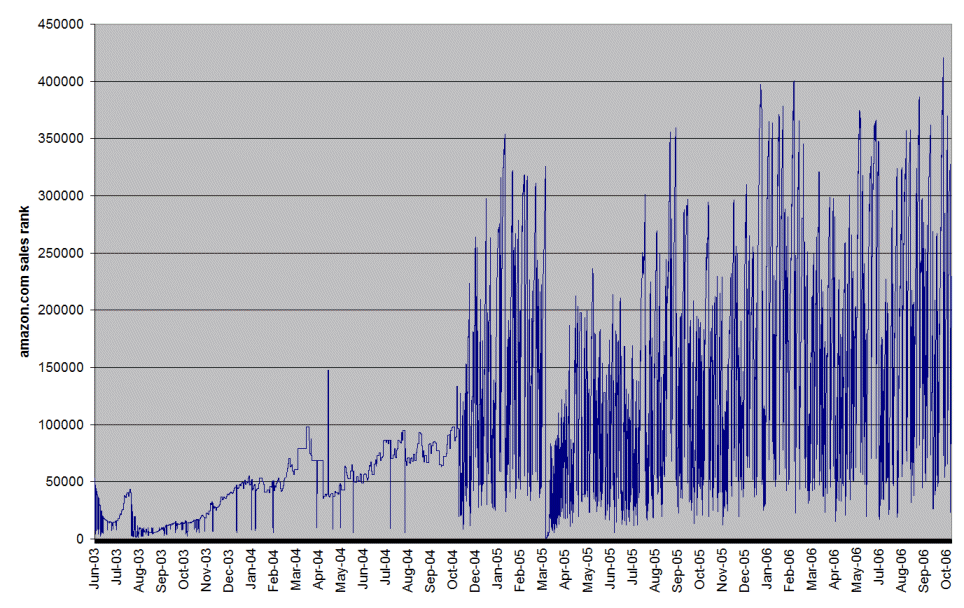
There is huge variation, and averaging the sales rank over longer periods
is clearly nonsensical.
To map the amazon.com sales rank to the book's weekly sales I used
data from an interesting paper by Erik Brynjolfsson and his colleagues.
In the paper, titled
Consumer Surplus in the Digital Economy: Estimating the Value of Increased Product Variety at Online Booksellers,
the authors outline how they mapped the amazon.com sales rank to actual
sales by repeating an experiment by two other researchers.
First, they obtained actual weekly sales data for a book with stable sales
from a publisher.
Then, within ten minutes they bought six copies of the book from amazon.com
and noted the book's sales rank before and after.
Using regression analysis they found that
Using that formula, I converted the hourly sales rank into an
estimated weekly sales figure, which I could then meaningfully
average over weekly periods.
The resulting chart made a lot more sense.
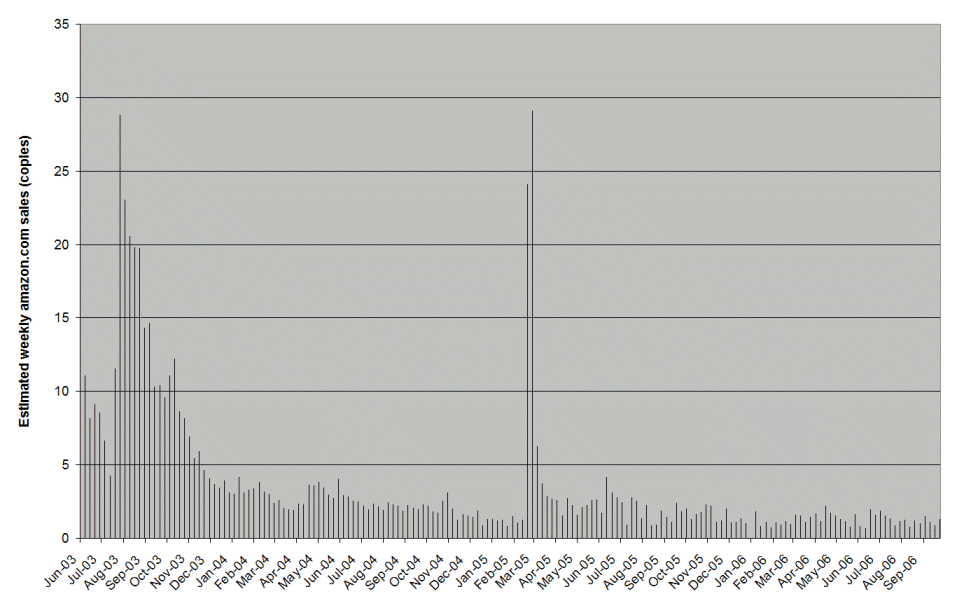
Surprisingly, when combined with amazon.com's market penetration the
sales figures also matched the sales numbers I get from my publisher
in their royalty statements.
The big spike on March 2005, coincides with the
book's review on slashdot.
It was apparently the only event that made a significant impact on sales.
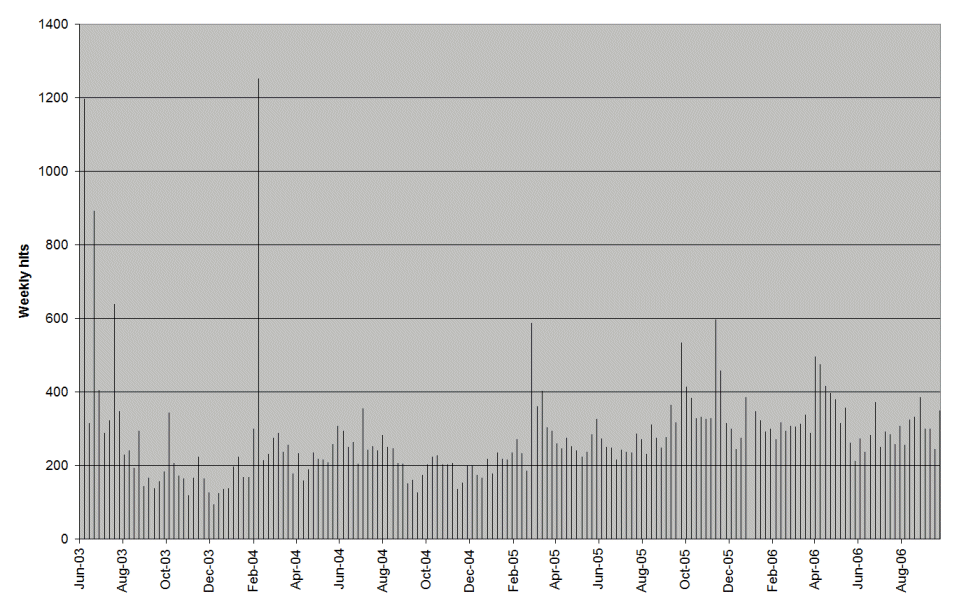
Finally, I examined the relationship between hits on the book's
web page
and the sales figures.
Charting the weekly hits on the book's index page did not
produce a result that matched the patterns of the sales.
However, when I plotted the two charts on top of each other,
I could see that often the two numbers matched in step.
As you can see, an additional 50-100 web page hits often appear together
with 1-2 additional book sales.
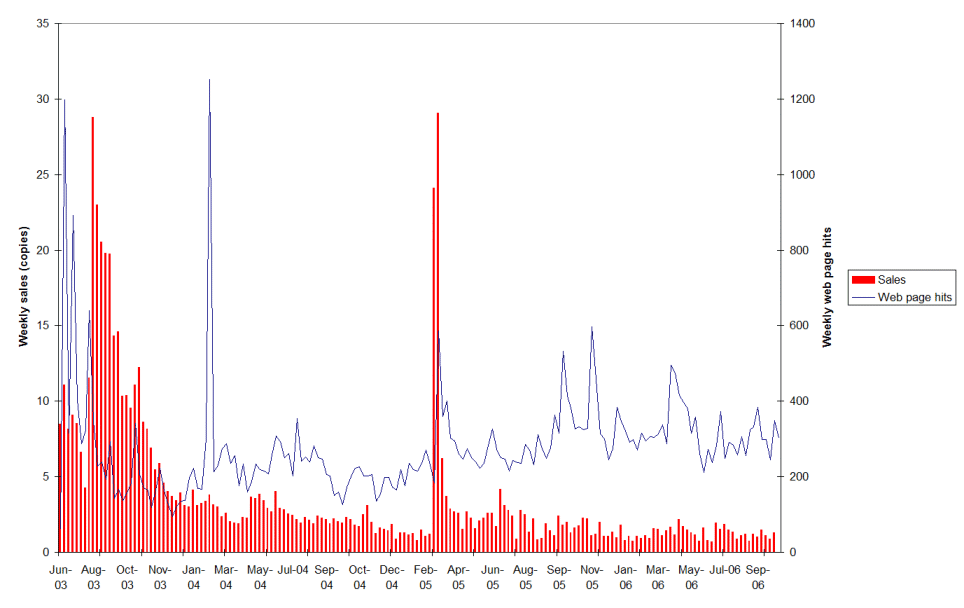
On the other hand, large increases in web page hits don't always
translate to sales.
I traced the large spike on February 2004 to a
reader comment in a slashot story concerning kernel development.
More than 1000 hits didn't results in any visible change in that week's sales.
Unix make vs Apache Airflow (2024-10-15)
How (and how not) to present related work (2024-08-05)
An exception handling revelation (2024-02-05)
Extending the life of TomTom wearables (2023-09-01)
How AGI can conquer the world and what to do about it (2023-04-13)
Twitter's overrated dissemination capacity (2023-04-02)
The hypocritical call to pause giant AI (2023-03-30)
AI deforests the knowledge’s ecosystem (2023-03-16)
How I fixed git-grep macOS UTF-8 support (2022-10-12)
Last modified: Wednesday, October 11, 2006 10:20 am
Unless otherwise expressly stated, all original material on this page created by Diomidis Spinellis is licensed under a Creative Commons Attribution-NonCommercial 4.0 International License.
