http://www.spinellis.gr/pubs/conf/2006-05-SANE-JTune/html/JTune.html
This is an HTML rendering of a working paper draft that led to a publication. The publication should always be cited in preference to this draft using the following reference:
  • Giorgos Gousios, Vassilios Karakoidas, and Diomidis Spinellis. Tuning Java's memory manager for high performance server applications. In Alexios Zavras, editor, Proceedings of the 5th International System Administration and Network Engineering Conference SANE 06, pages 69–83. NLUUG, Stichting SANE, May 2006. Green Open Access

Citation(s): 2 (selected).

This document is also available in PDF format.

The document's metadata is available in BibTeX format.

Find the publication on Google Scholar

This material is presented to ensure timely dissemination of scholarly and technical work. Copyright and all rights therein are retained by authors or by other copyright holders. All persons copying this information are expected to adhere to the terms and constraints invoked by each author's copyright. In most cases, these works may not be reposted without the explicit permission of the copyright holder.

Diomidis Spinellis Publications

Tuning Java's Memory Manager for High Performance Server Applications

Georgios Gousios, Vassilios Karakoidas, Diomidis Spinellis
Department of Management Science and Technology
Athens University of Economics and Business

Abstract

Java is a strong player in the application server market and thus the performance of its virtual machine is an important aspect of a server's performance. One of the components that affect the performance of a JVM is the memory manager, which also includes the garbage collector. Modern virtual machines offer a multitude of options for tuning the memory manager, which can have a significant impact on server application performance.
In this paper, we examine the effect of tuning the garbage collection in an application server environment. By employing both synthetic and real world application benchmarks, we assess the various garbage collection strategies offered by two popular virtual machines. Finally, we present a comprehensive list of generally applicable garbage collection guidelines.

1  Introduction

Java, and the J2EE platform, has made it to the datacentre. Being a widely deployed platform, it has also attracted the interest of researchers doing work on runtime optimisation and virtual machines.
An important component of the Java virtual machine (JVM) is its memory manager. Following the secure by default paradigm of the platform, Java does not allow explicit memory allocation and deallocation. Instead, the programmer relies upon the garbage collector to handle the menial tasks of memory management. Automatic memory management is not a novelty of the Java platform though; it existed from the first implementations of the Lisp language. However, it has since been criticised for its performance [14,21], especially compared to explicit memory management [11,22,7,15].
Modern virtual machines offer a choice of garbage collectors that are specifically targeted to certain types of workloads and allow for fine-tuning garbage collection parameters to match the exact requirements of a specific application. They also offer methods for measuring the effect of garbage collection on program execution. However, the complexity of both the offered options and that of the inner workings of garbage collection makes the process of tuning memory management a difficult task. The purpose of this work is to evaluate if and how the tuning of garbage collection can affect the performance of a J2EE on the two most popular virtual machines.

2  Memory Management for Java

2.1  Garbage Collection Basics

A garbage collected system consists of two basic entities: the mutator which performs the computation and thus affects the heap and the collector which performs the actual collection. Garbage collection systems are divided into two major categories depending on whether the mutator is allowed to work in parallel with the collector or not:
Stop-the-World:
All mutator threads are required to reach a safe point and yield control before the collector starts.
Concurrent:
The collector threads run in parallel with the mutator threads. In order to keep track of the heap state, concurrent collectors, depending on the implementation, require to be notified when a read or write occurs to a specific object in order to update their state (read/write barrier).
Stop-the-World (StW) collectors tend to be the strategy of choice for most generic workloads where high throughput is required, because the processing power they require is only proportionate to the heap size. However, StW collectors pause the mutator when they operate and pause times are also proportionate to the heap size, thus making them unsuitable for interactive or real-time systems featuring large heaps. On the other hand, incremental collectors tend to require more CPU resources as a result of the barrier-oriented operation but are able to offer, or even guarantee in some implementations, bounded pause times, thus making them suitable for interactive or real time workloads.

Collection Strategies

Memory in most programming systems is allocated in terms of variable-sized cells. Pointers and references are essentially links from one memory cell to another. Most garbage collection algorithms process memory cells recursively. The processing starts from a known area of memory, usually refereed to as root set and, following the links in memory, traverses all active memory areas. The root set usually consists of pointers in the processor registers, static memory sets and pointers on the execution stack and is generated dynamically before the garbage collector starts its operation.
The following strategies are used by the majority of garbage collected systems. We are only presenting the basic idea behind each strategy, since explaining the actual workings and available variations would require the printing space of a book. For further reference, Jones' classic text [17] is a very good source of detailed information.
Mark-sweep
The garbage collector first scans the accessible memory locations and marks them as such and then either returns the inaccessible memory addresses to the allocator (sweeping) or moves the accessible memory locations to consecutive memory addresses to avoid fragmentation (compaction).
Copying
Divides the memory into two areas, the so-called "From" and "To" spaces. Allocations only occur in the From semispace, using a cheap bump pointer allocator. During garbage collection, the accessible memory cells are copied from the From semispace to the To semispace recursively, starting from the roots. After garbage collection, the semispaces exchange roles.
Generational
According to the generational hypothesis [21], most objects die young and consequently older objects tend to live longer. Generational collection capitalises on the generational hypothesis by dividing the available memory space into multiple regions called generations. Garbage collector passes are less frequent as the generations grow older and objects are always allocated into the newest generation. If the object survives a garbage collection, it is promoted to an older generation. Each generation can have a separate garbage collection strategy.
Reference counting
Reference counting uses a counter per object to record the number of references to the object. The pointer is incremented each time a reference towards the object is created. The object is reclaimed when its reference count drops to zero. Reference counting is being extensively used by scripting languages such as Perl.
Copying garbage collection is unsuitable for general use because it requires twice the memory space than Mark-Sweep algorithms to work efficiently. However, it is used as the collection strategy of choice in the young generation semispace of generational collectors both because the allocation mechanism it offers is cheap and also because it compacts the heap while collecting garbage. Mark-Sweep garbage collection is most times followed by a compaction phase in order to avoid memory fragmentation. The compaction phase requires moving the objects to adjacent memory locations, thus making Mark-Sweep quite an expensive algorithm for large memory multiprocessor environments, unless a multithreaded heap compactor is employed. Simple reference counting is also unsuitable for high throughput environments because it requires objects to be reclaimed on pointer updates; if a pointer is removed and the reference count of the pointed object drops to zero, the runtime system is required to collect both that object and the objects it references. Furthermore, a major drawback of reference counting is its inability to collect circular data structures, such as doubly linked lists. Despite its drawbacks, the simplicity in the implementation of reference counting made it the preferred garbage collection strategy in runtime environments with a limited lifetime, such as scripting languages.

2.2  Interaction with the Java Runtime Environment

Memory in a typical JVM is organised in a series of mutable (garbage collected) and immutable zones. Class code is usually loaded in immutable space1 and remains there until the JVM is stopped. Also, the code emitted from the JIT compiler is temporarily stored in immutable space. The actual allocations take place in the heap, which is a contiguous memory area. The size of the heap is a very important performance factor for all JVMs because it affects the frequency and extent of garbage collections. Most JVMs use expandable heaps, starting with a minimal default size. Modern virtual machines also assign distinct parts of the heap to separate threads for allocations that occur within the thread operation in order to avoid contention from extensive heap locks in multithreaded environments.
The minimum allocation unit in Java is an object. Objects are created by instantiating classes and are allocated on the heap using a memory allocation policy, usually bump pointer allocation or segregated lists. Apart from the class member values, each object also contains additional data such as a pointer to the respective class methods and flags related to locking and garbage collection. In most virtual machines, object headers take up to 8-12 bytes of additional storage space for each object, and can therefore sadle a program with significant performance and space overhead. A lot of work has been put into compacting the object header [6], which, in some cases, resulted in space savings of up to 20%.
A failure to allocate space for an object triggers a garbage collection cycle. The root set is determined by conservatively scanning the stacks of running or suspended threads and the current values of the processor registers for potential pointers to the heap. Root set acquisition can also be a performance bottleneck in the case when a large number of threads is executed concurrently, though these costs can be amortised using clever co-operation of the garbage collector with the JIT.

3  Java Virtual Machines and Memory Management

Sun JVM 1.5

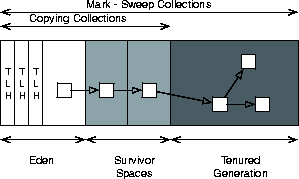
Sun's JVM is an implementation of the 1.5 version of the Java language specification. It features an adaptive optimising JIT compiler, the well-known Hotspot engine, and a choice of three garbage collectors [2,12]. Sun's JVM is based upon a generational copying garbage collector that utilises two generations. Figure 1 presents the heap organisation, which is shared among all collectors. Allocations initially occur in the eden space and survivors are promoted to one of the survivor spaces in a copying fashion. Optionally, portions of the heap space can be allocated to individual threads (Thread-Local Heaps (TLHs)), in order to speed up allocations on large-heap multithreaded environments. Objects that reach a certain age threshold, usually measured in minor garbage collection cycles, are copied to the tenured generation where they are left untouched until a major collection occurs. A mark-compact garbage collector is used for the tenured generation.
figs/sun-heap.png
Figure 1: Heap organisation in the Sun JVM
The default garbage collector in the Sun JVM is a single-threaded stop-the-world collector, which tries to be a low-overhead all-around solution. In order to address more specialised workloads, Sun has implemented two more collectors:
Throughput Collector
This is a multithreaded version of the young generation collector in order to speed up minor collections on large memory multiprocessor machines. Newer versions of the JVM also support multithreaded collections in the tenured generation.
Concurrent Collector
This is a collector thread that is executed in parallel with the mutator threads. It only collects garbage in the tenured generation in order to achieve guaranteed pause times in major collections. It also features an incremental mode that periodically stops the collection process to relinquish processor resources to mutator threads.

IBM JVM 1.5.0

IBM's JVM 1.5.0 offers a choice of two heap organisations; The default garbage collector in the IBM JVM is based on the Mark-Sweep algorithm extended with compacting capabilities and thread-local heaps [10,4,1,16]. The IBM garbage collector is highly parallelised; all three phases of the garbage collection process can run in parallel threads on multi-processor machines in order to minimise pauses and maximise throughput. Additionally, the marking and sweeping phases can also operate concurrently with the application threads. To avoid excessive heap locking during allocations, each application thread is granted a configurable amount of the heap space for small object allocations. A dynamically-sized special area in the heap is devoted solely to satisfy requests for large object allocations so as to prevent allocation failures due to memory fragmentation. Apart from the single heap mode, the IBM JVM can also operate in generational mode, much like the Sun JVM. In the IBM case however, the tenured generation is collected using exclusively a concurrent algorithm.

4  The Benchmarks

Virtual machine benchmarking is a complicated process since a lot of components, such as the adaptive JIT compiler and the garbage collector, can affect performance in a manner that is difficult to disentangle. In our experiments, we tried to minimise the effect of virtual machine components by forcing them into a mode that does not introduce unpredictability to our benchmarks, for example by performing several warm-up rounds to allow time to the JIT to optimise the hot code paths. We assessed various garbage collection configurations in both virtual machines using two sets of benchmarks:
Synthetic Benchmarking
We used the DaCapo memory management benchmark suite [19] in order to perform a comparative evaluation of various configurations of the tested virtual machines and decide for the best combinations to use in the real world benchmarks. The DaCapo benchmark consists of a series of memory intensive applications, such as the hsqldb database and the xalan XSLT processor, that are bundled together with standardised datasets. The DaCapo benchmark is throughput oriented and its workload is composed of real world applications; it is therefore suitable for pre-evaluation of garbage collection options in throughput sensitive environments, such as application servers.
Real World Application Benchmarks
We employed the commonly referred RUBiS application server benchmark [3,9]. RUBiS consists of a J2EE-based application that models an on-line auction web site and a distributed load generator. The server part of the benchmark has been implemented using various configurations of the J2EE stack, for example using a pure Servlet-JDBC environment or using Enterprise JavaBeans (EJBs) for data access. In order to model the most common application server usage scenarios, we chose the EJB_Session_facade configuration. The application was run on the JonAS application server with MySQL as the backend database. Both JonAS and MySQL were run on the same physical machine. We did not perform any performance-specific customisation of either JonAS or MySQL, apart from the minimal configuration that was required to run the RUBiS application.
We used two sources for benchmark data collection; the original output from each benchmark suite and a custom-made application that exploits the Java Management Extensions (JMX) [18] capabilities of virtual machines that conform to the 1.5 specification of the Java language. The JMX client application opens a persistent connection to the JVM that hosts the application server before the benchmark is started. A minimal overhead is imposed on the virtual machine by the JMX client, but the overhead is equally affecting both tested virtual machines since they share the same JMX implementation. The JMX client monitors the following runtime properties:

4.1  Benchmarking Configurations and Rationale

The synthetic benchmark suite is primarily used as a quick means of assessing the effect of the various options that are offered for fine tuning the garbage collectors for both virtual machines. At first, we used the default configuration in both cases in order to obtain a reference point (1). We then increased the minimum and maximum heap sizes to resemble more closely the actual running conditions on server-class hardware in terms of available memory space (2) and keep it constant in all benchmarking rounds. Since both virtual machines offer parallel and concurrent versions of their collectors, we enabled them in turn while maintaining the invariant of exercising only one type of collector per benchmark round.
We first enabled the throughput collector for the young generation (3) and then exercised the throughput collector for both the new and the old generations (4). The theoretical maximum throughput, as proposed by [13], should be achieved using the full throughput collector coupled with thread-local heaps(5). Then, we tested the concurrent collector in the default (6) and incremental modes (7) and finally in incremental mode with auto-tuning of increments (8), in order to assess the overhead the incremental collection incurs to the application. The IBM virtual machine is better on self-configuring the garbage collector optimally for the hardware it runs on; for example it automatically enables parallel collection on multiprocessor machines. Therefore, only the three default garbage collection strategies were exercised in the context of the synthetic benchmark. The maximum throughput is theoretically delivered by disabling the compaction phase while using the parallel collector. Table 4.1 summarises the command line options used in the synthetic benchmark. We try to present similar policies in both virtual machines side-by-side.
Bench. Sun JVM IBM JVM
1 -server -
2 -server -Xms256M -Xmx4000M -Xms256M -Xmx4000M
3 -XX:+UseParallelGC -Xgcpolicy:optthruput
4 -XX:+UseParallelOldGC -
5 -XX:+UseParallelOldGC -XX:+UseTLE -Xgcpolicy:optthruput -Xnocompactgc
6 -XX:+UseConcMarkSweepGC -Xgcpolicy:optavgpause
7 -XX:+UseConcMarkSweepGC -XX:+CMSIncrementalMode -
8 -XX:+UseConcMarkSweepGC -XX:+CMSIncrementalMode -XX:+CMSIncrementalPacing -Xgcpolicy:gencon
Table 1: Default configurations for the synthetic benchmark
The RUBiS benchmarking process is based on the findings of the DaCapo benchmark. We run the RUBiS test application three times on each virtual machine using different configurations for the garbage collectors. The RUBiS load generator was configured identically across all benchmarking rounds. Specifically, we used the default state transition map to feed the generator and we configured it to simulate 500 concurrent clients, with a mean think time of seven seconds. In order to allow the application server to gracefully scale its resources to a state where it will be able to handle the benchmark workload, we used a ramp-up period of five minutes.

4.2  Test Environment Setup

Our test setup consisted of a high performance server platform running Suse Linux 9.3 (64-bit) connected to a 1Gbps switched network of clients. No client was actively used during the benchmarking period apart from the load generator. The server hardware utilised twin AMD Opteron 2.2GHz processors, 8GB of memory and a RAID-1 array of 15k RPM SCSI hard disks. All the applications we used were compiled for a 64-bit environment and were the default versions installed by Suse. No kernel customisations were performed on the server. Table 2 presents the application versions we used for running the benchmarks.
The load generator machine featured dual Xeon 2.8GHz processors (Hyper-Threading was enabled) configured with 2GB of main memory. The operating system is RedHat Enterprise Linux 3 with kernel 2.4.20. The load generator machine was also used to run the JMX monitoring application.
Application Version
Linux Kernel 2.6.11.4-21.10-smp
Sun JDK 1.5.0_03-b07
IBM JDK IBM J9 VM (j9vmxa6423-20051103)
JoNAS 4.7.1
MySQL 4.1.10a
RUBiS 1.4.3
Table 2: Versions of the tested platforms

5  Results

5.1  The DaCapo Benchmark

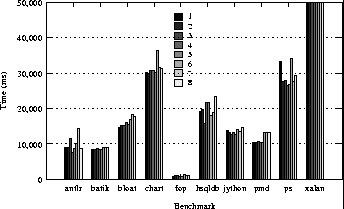
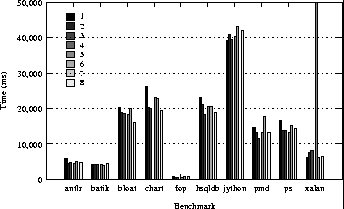
The DaCapo benchmark uses memory intensive applications to generate a workload that exercises the virtual machine's garbage collector. On modern hardware, the DaCapo benchmark executes too fast to allow for safe conclusions to be drawn. This fact makes it particularly restrictive to allow for a comparative evaluation of the tested virtual machines. However, when all parameters except the garbage collection algorithm are maintained, the choice of the algorithm can by itself affect the results in a foreseeable manner. Having considered the above, the DaCapo benchmark results can be a valuable tool for a quick evaluation of the garbage collector implementations for a single virtual machine. The results from the Dacapo benchmark are presented in Figure 2.
In the case of the Sun JVM, the default configuration seems to perform well enough in most tests. It actually managed to outperform all other implementations in four out of eight tests. This happened because all the DaCapo benchmarks are specifically chosen to impose a heavy load on the object allocator. The pure generational nature of the default garbage collector allows it to provide fast allocation performance based on the copying nursery while on the other hand, the benchmark duration did not allow many objects to mature enough to be copied to the tenured space. The throughput-oriented parallel collectors did not provide any additional performance benefit except from the benchmarks with extremely high allocation rates.2 The concurrent collector worked better in incremental mode, probably due to the fact that it allowed for more CPU power to be allocated to processing threads.
The IBM garbage collector benefits more from manual tuning. In most benchmarks, the hand-tuned heap size configuration was faster than the default configuration while the throughput collection policy offered a performance benefit in most applications. However, turning off heap compaction did not offer any significant performance advantages, especially for benchmarks with high allocation rates. On the other hand, the average pause collection strategy did not impact performance significantly, being faster in most cases than the default collection strategy. Finally, the generational heap organisation offered better performance, throughput-wise, than the incremental collector, even though the average pause time was not of interest for the purposes of our work and therefore was not exercised.
The DaCapo benchmark revealed three interesting properties that are common across both virtual machines:
dacapo/sun-graph.png dacapo/ibm-graph.png
Figure 2: Dacapo benchmark results

5.2  The RUBiS Benchmark

The goal of the RUBiS benchmark was to enable us to understand the effect of garbage collection tuning on real application performance. We followed a step-by-step approach maintaining the invariant of turning only one knob at any time.
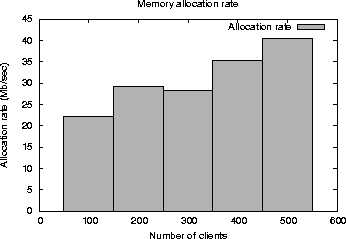
The first experiment we run measured the memory allocation rate while the benchmark was running under full load. The RUBiS server application was exposed to a client load ranging from 100 to 500 concurrent clients. We employed the Sun JVM verbose garbage collector option (-Xloggc) to collect a trace of the performed collections. We then used the excellent HPJTune utility to process the trace and calculate the average memory allocation. We only measured the allocation rate during the actual benchmarking state; during the ramp-up period, the allocation rate was, as expected, much higher. The results are presented in Figure 3.
rubis/mem-alloc.png
Figure 3: Memory allocation rate for the RUBiS benchmark
The memory allocation rate was a good starting point for tuning the garbage collector. Considering the outcome from the DaCapo application, a high allocation rate would indicate the use of a parallel collector. Interestingly enough, the object pooling facilities that JonAS is using alleviates some of the memory management pressure at the expense of high memory usage which is a reasonable choice for server environments. However, using object pooling can have a negative impact on non-generational collectors; the extend of the heap scans will be proportional to the number of pooled objects. Therefore, the IBM JVM is expected, by default, to spend more time than the Sun equivalent on garbage collections given the same heap size. On the other hand, a concurrent collector could allow both virtual machines to offer competitive performance, since the raw allocation rate is not too high for a concurrent thread to cope with, especially considering the hardware we used.
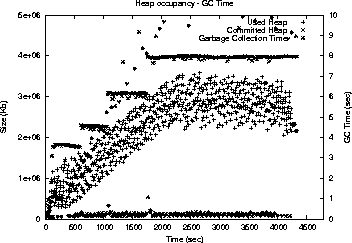
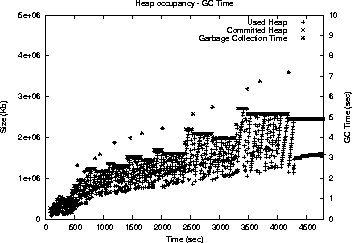
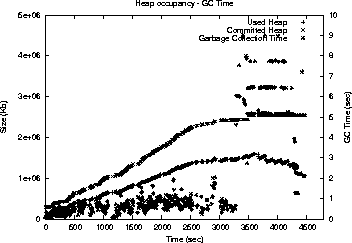
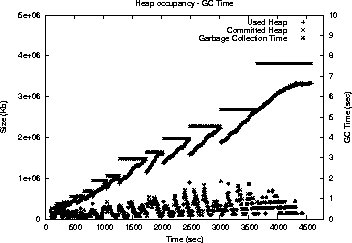
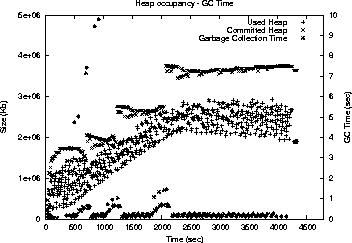
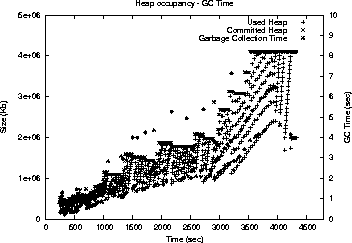
We selected the configurations to benchmark by combining the DaCapo benchmark findings and the assumptions presented above. We tested a high throughput configuration, a concurrent configuration and, as a reference, the default configuration for each virtual machine. We measured the number of successful transactions per second, the average time to satisfy a request, the percentage of failed requests and the total time spent on garbage collecting the heap. For the analysis, we only considered the results of the stable run of the benchmark, which are presented into Table 3. In Figure 4, we present the data collected using the JMX monitoring application for all benchmarking rounds.
Configuration Sun JVM IBM JVM
TPS Avg. Resp. Time (msec)Err. Rate Total GC Time (sec)TPS Avg. Resp. Time (msec)Err. RateTotal GC Time (sec)
default 72 934 0,013% 573 31 10097 0,028% 292
throughput 60 2196 0,0033% 1068 43 5582 0,014% 379
concurrent 26 12451 0,027% 1166 31 9859 0,021% 406
Table 3: RUBiS benchmark results. For each JVM and each configuration, the throughput in transactions per second, the mean time to satisfy a request and the percentage of errors are presented.
rubis/bench3.png rubis/bench6.png
rubis/bench2.png
rubis/bench5.png
rubis/bench1.png
rubis/bench4.png
Figure 4: Heap occupancy during the RUBiS benchmark. The top row presents the default configurations, the second the incremental configurations and the last row parallel collection configurations. The IBM JVM and the Sun JVM results are presented on the right and at the left respectively.
When considering absolute performance, the default configuration of the Sun JVM performed best. Not only did it offer the highest throughput, but also the lowest mean response time and the lowest error rate from all configurations we tested. The heap occupancy graphs are characteristic of a generational collector; most collections occur in the eden and thus the collection time is very fast. The full heap collections, though, can cause unpredictable pauses; the longest pause we measured was as high as 12 seconds. On the other hand, the parallel collector behaved erratically; instead of decreasing total collection time, it increased it by 95%. Also, it failed to decrease the average pause time while the worst pause time was more that 32 seconds. The incremental collector presented a predictive low-pause behaviour, but it did not manage to maintain it throughout the test. Since this collector only operates as an aid to reduce collection time in major collections, this behaviour was expected as the memory pressure increased and, possibly, heap compaction became necessary.
The data collected when running the benchmark using the IBM JVM were closer to what we expected. The default and the throughput configurations worked almost identically, since the JVM defaults to using the parallel collector on multiprocessor machines. However, for reasons that have to do with the internal workings of the JVM, the throughput version manages to outperform the default version by 38% in the raw transactions per second metric, while providing a faster mean response time and a lower error rate and also reducing the total collection time by 25%. The IBM default/parallel collection seems a very efficient implementation; the pause time is never more than 8 seconds while collecting more than one gigabyte of garbage in every pass. Moreover, in order to keep the pause times low, the heap never expands to more than it is absolutely necessary, thus decreasing the memory pressure on the host operating system. The incremental collector also delivers its promised results, by keeping the pause time very low (less than 2 seconds in all cases) at the expense of reduced throughput. Being a generational collector, it tends to consume much more memory than the default collector, although this may attributed to the fact that some objects can become garbage after the incremental collector has scanned them (usually refereed to as floating garbage).

6  Garbage Collector Tuning Guidelines

In this section, we present the conclusions drawn from our experiments in the form of a comprehensive checklist. Administrators seeking to improve the performance of their J2EE servers could find useful information in it.
Observation Problem Action
Many spikes in total collection times Too much time spent in full heap collections or memory compaction Use a parallel collector, turn off heap compaction (dangerous)
Too frequent full heap collections Heap size is small Increase heap size or use an incremental collector to avoid large pauses
Too many garbage collected in each collection roundHigh allocation rate or too frequent full heap collections Increase heap size, use parallel collector, use thread local heaps
Large differences between committed and used heap Heap size is too big Decrease heap size, allow more space for young generations
Committed heap size is constantly increasing Application is caching too many objects Decrease object pool sizes, tune the application server to close open connections faster, use large object spaces
Table 4: Diagnosing performance problems from the diagrams

7  Related work

Measuring J2EE application performance can be a difficult task. The performance is usually measured through a benchmarking process, and many benchmarks were developed as an attempt to standarize J2EE perfomance metrics. Popular ones are the ECperf [8] and the RUBiS [3] benchmarks. Pugh and Spacco [20] show that the results reported in [3] are not valid. They also assert that benchmark results can be greatly affected by a number parameters on the the database server, the transaction engine or the garbage collector.
Several studies have comparatively evaluated the performance of various garbage collection strategies on the same virtual machine; in fact, most research in the field of garbage collection usually entails the benchmarking of a newly proposed collection strategy against established ones. Interesting work includes the papers by Blackburn et al [7] and Hertz et al [15] which try to quantify the real performance impact of various garbage collection implementations on real world applications and also the work presented by Attanasio et al [5] which compares all known parallel GC implementations.

8  Conclusions and future work

Tuning the Java garbage collector for optimal performance in server environments has long been regarded as a difficult and complex exercise. This paper presented an empirical method and its evaluation using server class hardware and popular implementations of the JVM. The complexity and subsequent unpredictability of modern virtual machines proved a negative factor for optimally configuring the garbage collector. A limitation of our work is the fact that we only tested one application, on one hardware and software platform. However, the guidelines we presented are generally applicable and do not depend on any combination of hardware or software.
This work can be extended by examining the behaviour of more application server benchmarks on more virtual machines. Also, the verbose garbage collection output, present in most virtual machines, can provide useful hints for tuning the garbage collector for a specific virtual machine; mining through the results of multiple virtual machines running a variety of benchmarks could reveal interesting generic rules.

References

[1]
IBM JVM garbage collection and storage allocation techniques. Technical report, IBM, http://www-128.ibm.com/developerworks/java/jdk/diagnosis/, 2005.
[2]
Tuning garbage collection with the 5.0 Java virtual machine. Technical report, Sun Microsystems, Inc, 2005.
[3]
C. Amza, A. Chanda, A.L. Cox, S. Elnikety, R. Gil, K. Rajamani, W. Zwaenepoel, E. Cecchet, and J. Marguerite. Specification and implementation of dynamic web site benchmarks. In IEEE International Workshop on Workload Characterization, pages 3-13, Houston, TX, USA, Nov 2002. IEEE.
[4]
Sripathi Kodi Aruna Kalagnanam. Mash the trash - incremental compaction in the IBM JDK garbage collector. Technical report, IBM, http://www-128.ibm.com/developerworks/ibm/library/i-incrcomp/, 2003.
[5]
Clement R. Attanasio, David F. Bacon, Anthony Cocchi, and Stephen Smith. A comparative evaluation of parallel garbage collector implementations. Lecture Notes in Computer Science, 2624:177-192, January 2003.
[6]
David F. Bacon, Stephen J. Fink, and David Grove. Space- and Time-efficient implementation of the Java object model. In ECOOP '02: Proceedings of the 16th European Conference on Object-Oriented Programming, pages 111-132. Springer-Verlag, 2002.
[7]
Stephen M. Blackburn, Perry Cheng, and Kathryn S. McKinley. Myths and realities: the performance impact of garbage collection. In SIGMETRICS 2004/PERFORMANCE 2004: Proceedings of the joint international conference on Measurement and modeling of computer systems, pages 25-36. ACM Press, 2004.
[8]
Paul Brebner and Jeffrey Gosper. J2EE infrastructure scalability and throughput estimation. SIGMETRICS Perform. Eval. Rev., 31(3):30-36, 2003.
[9]
Emmanuel Cecchet, Julie Marguerite, and Willy Zwaenepoel. Performance and scalability of EJB applications. In OOPSLA '02: Proceedings of the 17th ACM SIGPLAN conference on Object-oriented programming, systems, languages, and applications, pages 246-261, New York, NY, USA, 2002. ACM Press.
[10]
Sumit Chawla. Fine-tuning Java garbage collection performance. Technical report, IBM, http://www-128.ibm.com/developerworks/library/i-gctroub/, 2003.
[11]
David L. Detlefs. Concurrent garbage collection for C++. In Peter Lee, editor, Topics in Advanced Language Implementation. MIT Press, 1991.
[12]
L. Dykstra, W. Srisa-an, and J.M. Chang. An analysis of the garbage collection performance in Sun's Hotspot Java virtual machine. In Conference Proceedings of the IEEE International Performance, Computing, and Communications Conference, pages 335-339, Phoenix, AZ, USA, April 2002.
[13]
Alka Gupta and Michael Doyle. Turbo-charging Java hotspot virtual machine, v1.4.x to improve the performance and scalability of application servers. Technical report, Sun Microsystems, 2002.
[14]
Jr. Guy L. Steele. Multiprocessing compactifying garbage collection. Commun. ACM, 18(9):495-508, 1975.
[15]
Matthew Hertz and Emery D. Berger. Quantifying the performance of garbage collection vs. explicit memory management. In OOPSLA '05: Proceedings of the 20th annual ACM SIGPLAN conference on Object oriented programming systems languages and applications, pages 313-326, New York, NY, USA, 2005. ACM Press.
[16]
IBM. IBM developer kit and runtime environment, Java 2 technology edition,version 5.0, diagnostics guide. Technical report, IBM, 2005.
[17]
Richard E. Jones and Rafael Lins. Garbage Collection: Algorithms for Automatic Dynamic Memory Management. Wiley, Chichester, 1996. With a chapter on Distributed Garbage Collection by R. Lins.
[18]
Eamonn McManus. JSR 3: Java Management Extensions (JMX) specification. Technical report, Sun Microsystems, Inc, 2000.
[19]
DaCapo Project. The DaCapo benchmark suite. http://www-ali.cs.umass.edu/DaCapo/gcbm.html, 2005.
[20]
Bill Pugh and Jaime Spacco. Rubis revisited: why J2EE benchmarking is hard. In OOPSLA '04: Companion to the 19th annual ACM SIGPLAN conference on Object-oriented programming systems, languages, and applications, pages 204-205, New York, NY, USA, 2004. ACM Press.
[21]
David Ungar. Generation scavenging: A non-disruptive high performance storage reclamation algorithm. In SDE 1: Proceedings of the first ACM SIGSOFT/SIGPLAN software engineering symposium on Practical software development environments, pages 157-167, New York, NY, USA, 1984. ACM Press.
[22]
Benjamin Zorn. The measured cost of conservative garbage collection. Software Practice and Experience, 23:733-756, 1993.

Footnotes:

1Recent JVMs offer options to unload unused classes during garbage collection cycles in order to conserve memory.
2The hsqldb allocation rate climbed to 270 MB/sec while the batik allocation rate was only 11 MB/sec